
Drive-in banks were established so most of the cars today could see their real owners. – E. Joseph Crossman
I have long thought that cars were a great destroyer of middle-class wealth. Recently I stumbled across some evidence confirming this. The evidence came in the form of a graph created by the Wall Street Journal using recently released data from the US Labor Department. The graph shows the spending patterns of people at different income levels in the US. I have included it below:
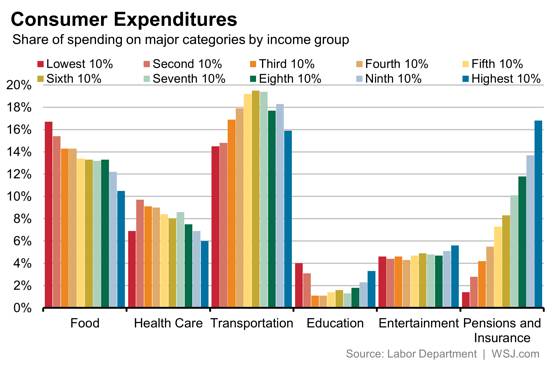
The graph divides Americans into ten income groups and shows how much each group spends, as a percentage of their income, in several common spending categories. A close look at the graph reveals some interesting patterns.
As you would expect, lower income groups spend a much greater percentage of their income on necessities than those who make more. While Housing is not shown in this graph the data show that the bottom ten percent spend 59% of their income on Food and Housing combined, while the top 10 percent spend only 42%. Food and Housing are necessities and the poor are doing what they need to do to survive. Add in spending on Health Care and Transportation and there is not much left.
Top income earners, on the other hand, spend a much higher percentage of their income on Pensions and Insurance (under 2% for the bottom group progressing up to almost 17% for the top group). Again, this is what you would expect. The poor have little left to put towards improving their futures while the main goal of the well-off is protecting and growing what they have.
Transportation Expenditures
What I found interesting is the Transportation spending patterns of the different groups. As the graph shows, the middle-income groups spend a significantly higher percentage of their income on Transportation than either the poor or the well-off. While the poorest group spends just over 14% on Transportation, and the richest group about 16%, income groups five through seven spend about 19%.
Consider the case of Joe Average. Joe starts out his working life towards the bottom of the income distribution. Joe works hard, takes advantage of all the on-the-job training he can get, and receives a couple of promotions. Joe also spends money on education, receiving specialized training and eventually a degree. More promotions follow.
Through all this hard work Joe progresses up the income ladder, eventually reaching the “Sixth 10%” group shown above. He begins to feel more financially secure. He is rightly proud of the progress he has made and wants to show everyone he has arrived. To do so Joe purchases a brand new Lexus RC 350 that costs over $45,000. Joe realizes this is a lot to pay for a car but he has worked hard, and he deserves it.
Ironically, the symbol Joe has chosen to announce his progress to the world makes further progress much more difficult. This new status symbol not only costs too much now, but it will rapidly depreciate and before long he will again be forced to make the decision on whether to keep up appearances or make a better financial decision. Having once announced to the world that he has arrived, spending less on his next car becomes even more difficult, and the pattern of wealth destruction likely repeats itself. Once you get on the hedonistic treadmill getting off can prove to be difficult.
A Wiser Choice
A wiser choice for Joe would be to freeze his Transportation spending at the 14% of his income he was spending when he first started out. Since he is earning significantly more now this would still allow him to buy a much nicer ride, but without jeopardizing his financial future.
The 4-5% of his income Joe would not be spending on Transportation could then be put towards Pension and Insurance, making Joe’s spending in this category more like those in the Eighth or Ninth 10%. Keeping this up for a period of time would allow Joe to continue his financial progress.
Joe would then have a car that would get him where he needed to be today and a spending and savings plan that would get him where he needed to be tomorrow. This would make Joe not average, but exceptional. And the only change Joe needs to make is to stop allowing his car purchases to destroy so much of his wealth.
Like Joe, each of us must also choose. So what will it be? Average or exceptional? The choice is yours.
It looks like all income groups are spending a bit too much on transportation. I agree that the middle class gets burned much more than they need too, but the poor are suffering here too. My wife and I did pretty well in the transportation department – always paying cash. We shared one car for 7 years (until our son was born), then drove low-mile used Honda Accords & Toyota Corollas for another 7 years. Then I was fortunate enough to get a luxury SUV as a company car. She bought a pretty practical Acura TSX (Honda Accord in Europe) with just 14K miles. Since we reached the upper income groups on your chart we have splurged a bit on cars with a luxury German SUV, sedan & roadster. The key is we did it after we became financially independent.
It is definitely true that the poor spend too much on transportation as well, but they usually don’t have any choice. For the middle class, however, their excessive level of spending on transportation is a self-inflicted wound.